Mastering Data Analysis in Excel by Duke University
You can find this wonderful course on Coursera here.
1.Introduction to this Course
Great business analysts have been called the “unicorns” of the business world. They are supposed to deeply understand business concepts, wield powerful quantitative skills, execute exceptional critical and structured thinking, and persuasively communicate complicated concepts using exciting visualizations and non-technical knowledge.
- By the end of this specialization, you will be able to:
\1. Understand and be able to identify relevant business metrics (Course 1: Business Metrics for Data-Driven Companies)
\2. Be an expert in using Excel to do business data analysis (Course 2: Mastering Data Analysis in Excel)
\3. Be a Tableau power-user who can produce compelling dynamic data visualizations, and an experienced presenter of persuasive business proposals (Course 3: Data Visualization and Communication with Tableau)
\4. Be a specialist in using Structured Query Language, or SQL, to retrieve and analyze big data from industrial-sized relational databases (Course 4: Managing Big Data with MySQL)
2.Basic Excel Syntax
i.Basic Excel Vocabulary; Intro to Charting
-
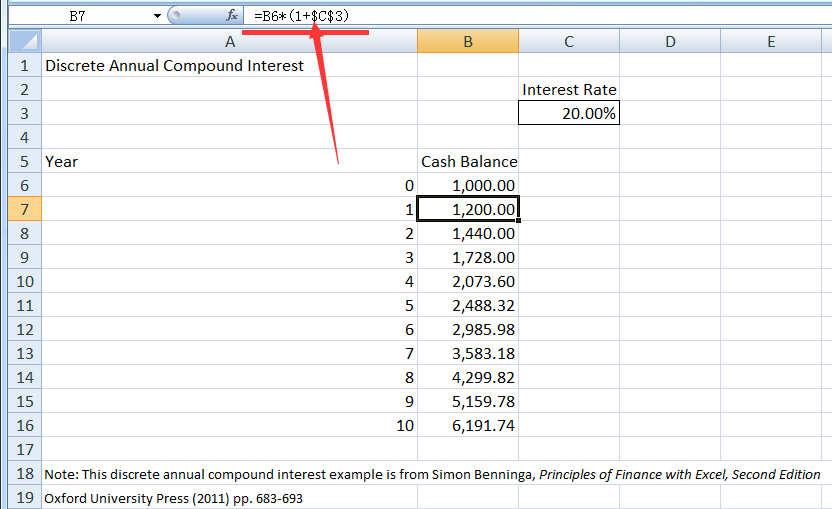
use = to activate the formula
-
double click the handle to generate the rest of all
- use the $ sign as a shortcut
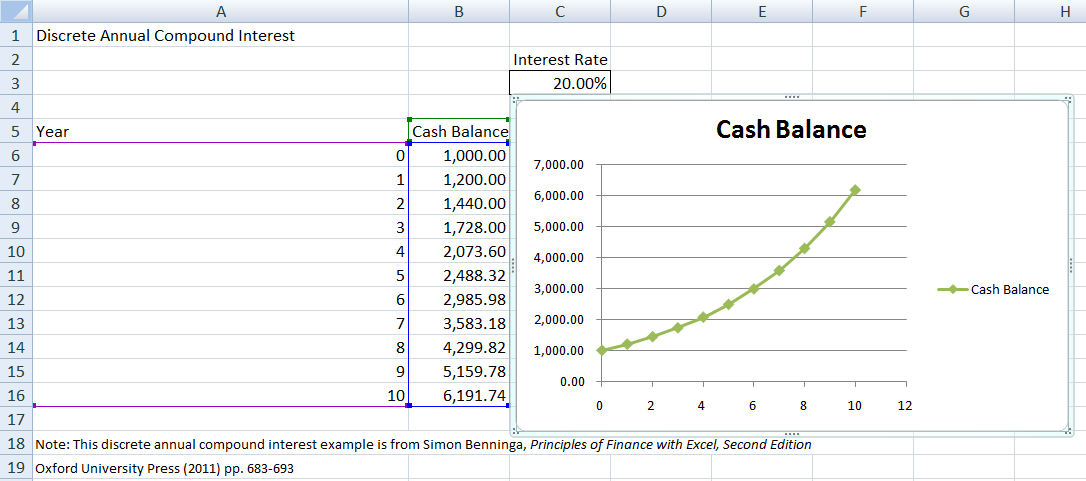
- generate the line chart with scatters in the chart
ii.Arithmetic in Excel
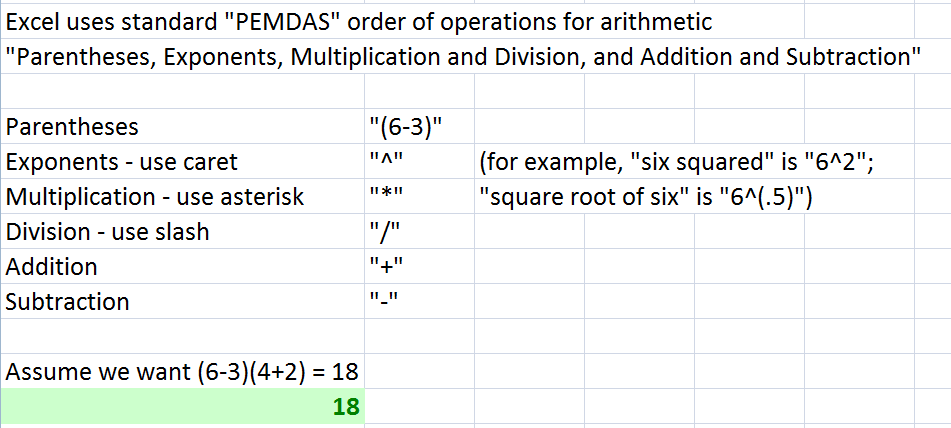
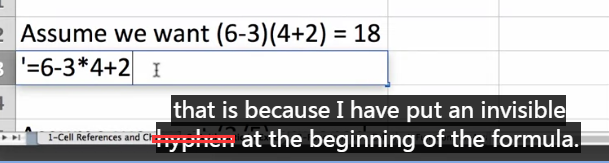
- **raw input with apostrophe’ **
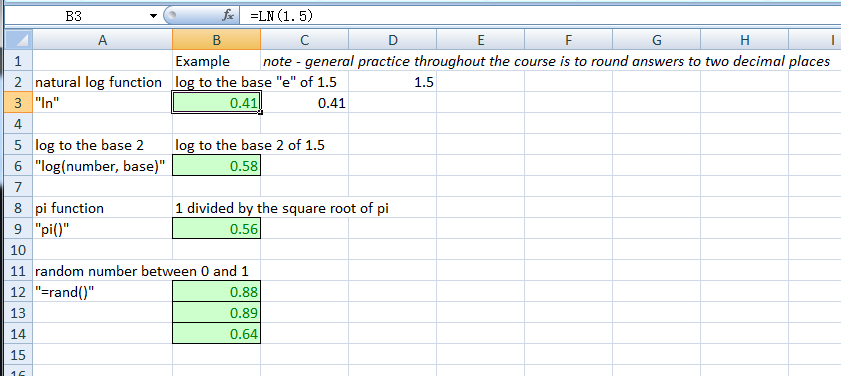
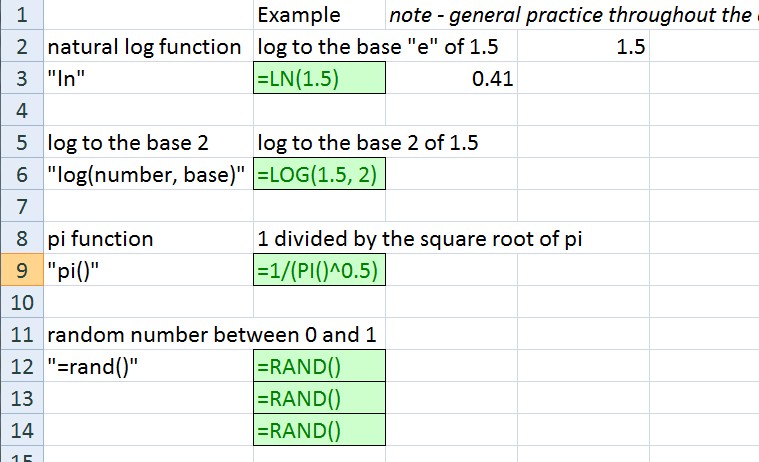
iii.Functions on Individual Cells
Excels have hundreds of built-in functions.
3.Functions on Arrays
i.Functions on a Set of Numbers
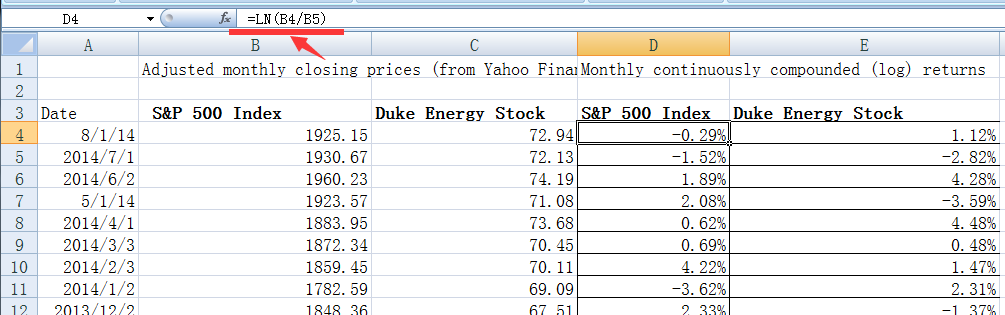
To calculate the continuously compounded or log monthly return by taking the natural log of the ration of the two prices with the more recent price on top.
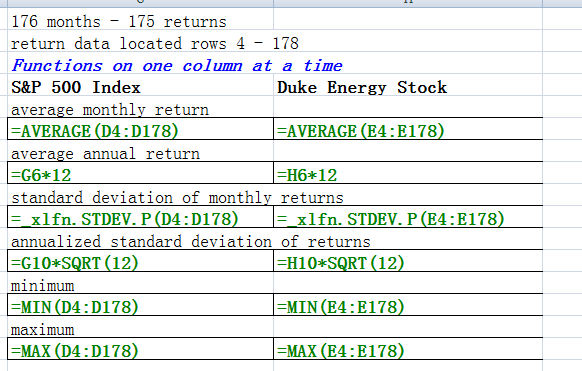
Functions on one column at a time.
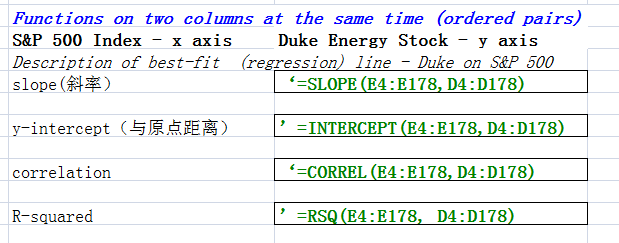
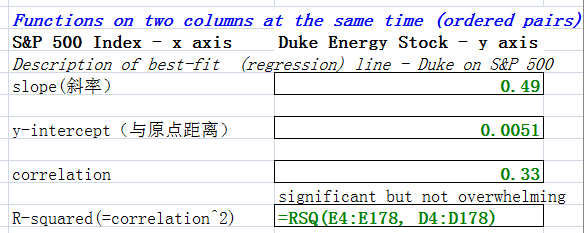
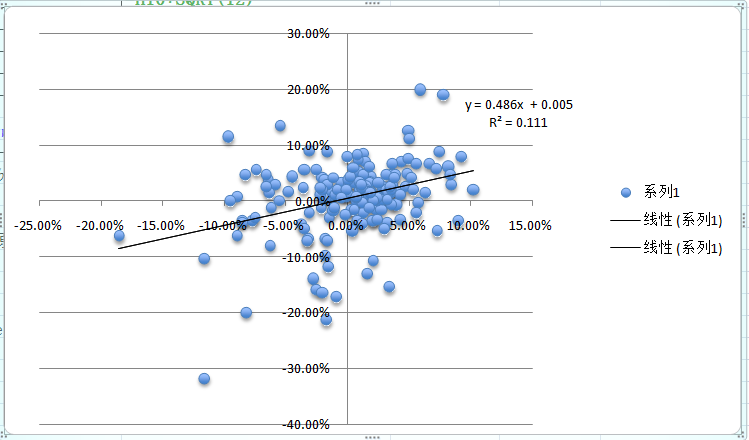
ii.Functions on Ordered Pairs of Data
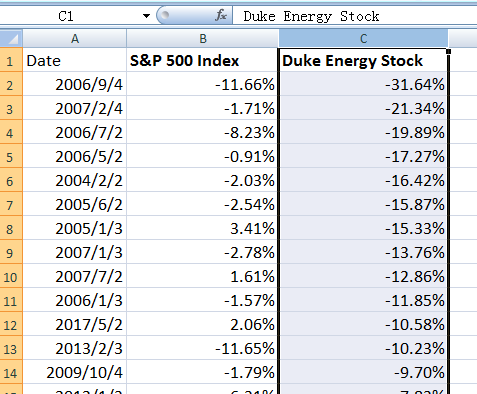
iii.Sorting Data in Excel
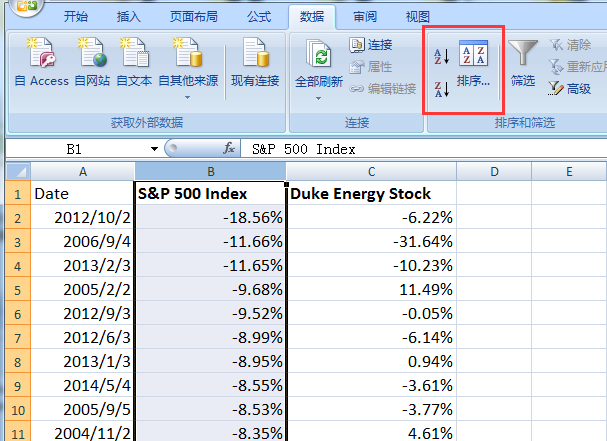
And if we look at ascending order, we see that we have a number of months when Duke Energy stock was dramatically off. And in most cases, the S&P 500 Index was also down but far far less.
So what this tells us perhaps is that when the S&P Index is down a little bit, and there’s perhaps some bad news about Duke Energy stock at all,the market tends to react with much more volatility with regard to Duke Energy stock than it does with the index as a whole.
iv.Introduction to the Solver Plug-in
The most powerful tools that can be used with Excel.